


Construction schedules are no longer just Gantt charts tacked to a trailer wall. In 2025, construction scheduling software, field apps, and budget dashboards pump out more data than most mid‑size general contractors (GCs) know what to do with. The result? Teams drown in daily logs yet still miss the signals that predict project delays and cost overruns.
This article moves beyond generic “on‑time vs. late” talk and offers five laser‑focused construction KPIs every mid‑size GC should track, but usually doesn’t. Woven through each metric is a leadership tactic you can act on next week, plus the search terms your peers are already finding resources for (“crew productivity,” “look‑ahead schedule,” “RFI turnaround,” “construction analytics,” and more).
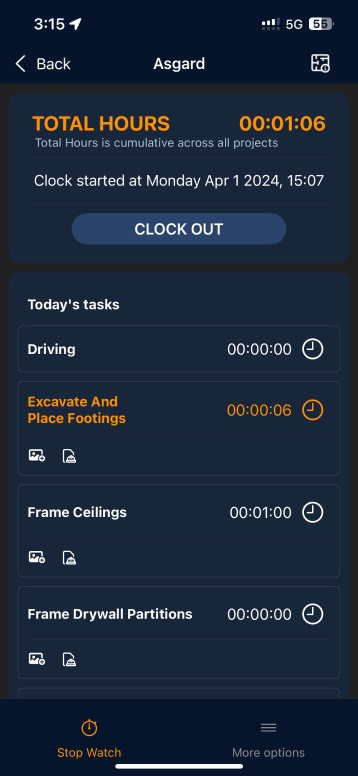
1. Crew Idle‑Time Ratio
Why it matters
Every superintendent feels the burn of idle labor, but few quantify it. On a recent retail build in Phoenix, a single crew idling 90 minutes per day cost the GC $42 K in unbillable wages.
How to track
Capture start/stop times in your GC scheduling software or using a simple mobile timecard app. Divide “non‑productive” hours by total hours on‑site.
Leadership move: Post a color‑coded dashboard in the trailer. When crews see their idle column glowing red, peer accountability kicks in fast.
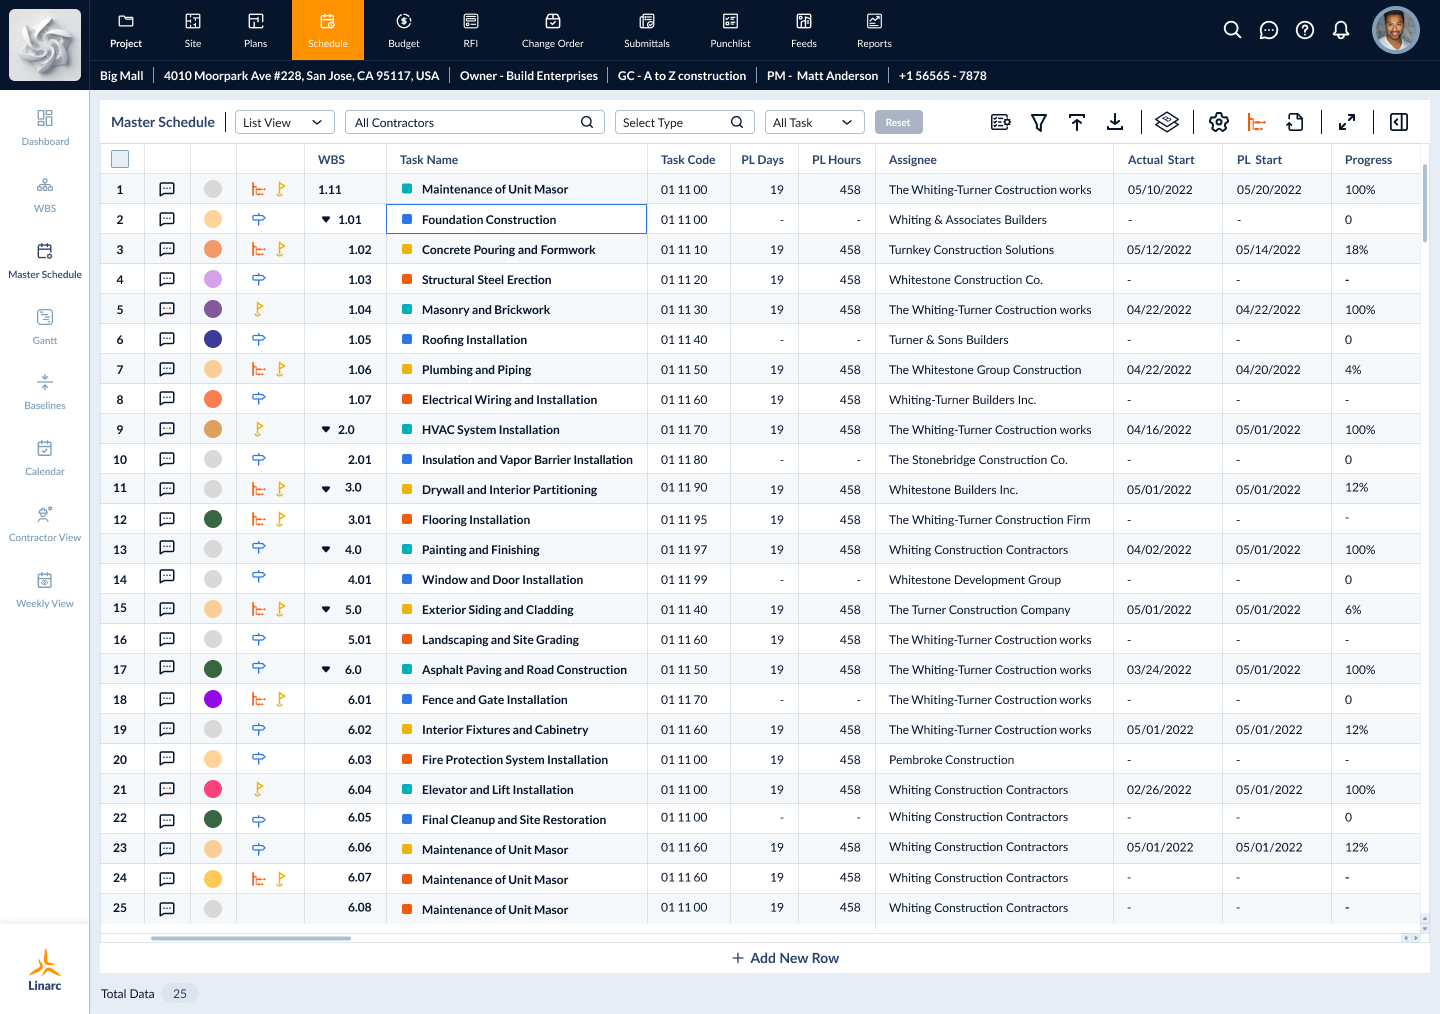
2. 48‑Hour Look‑Ahead Hit Rate
Why it matters
Long look‑aheads are great for the owner, but tomorrow’s tasks decide whether rebar shows up on time. A hit rate below 85 % is an early warning that you’ll be hunting change orders later.
How to track
Your field app already knows tomorrow’s tasks. Compare the “planned start” versus the “actual start” for tasks within the next two days.
Leadership move: Text a daily “two‑day radar” to supers at 3 PM. The next morning, they arrive knowing exactly what can’t slip.
3. RFI Cycle Rebound
Why it matters
Most PMs record how long an RFI waits for an answer, but ignore the lag between the answer and the schedule update. That blind spot was the root cause of a 17‑day slip on a Denver multifamily job.
How to track
Log the timestamp when an RFI is answered and again when the schedule (or cost code) is updated. The delta is your rebound time.
Leadership move: Tie “RFI closed” status to an automatic prompt: “Did this change dates or dollars?” Schedule updates happen in real time, not next week’s meeting.
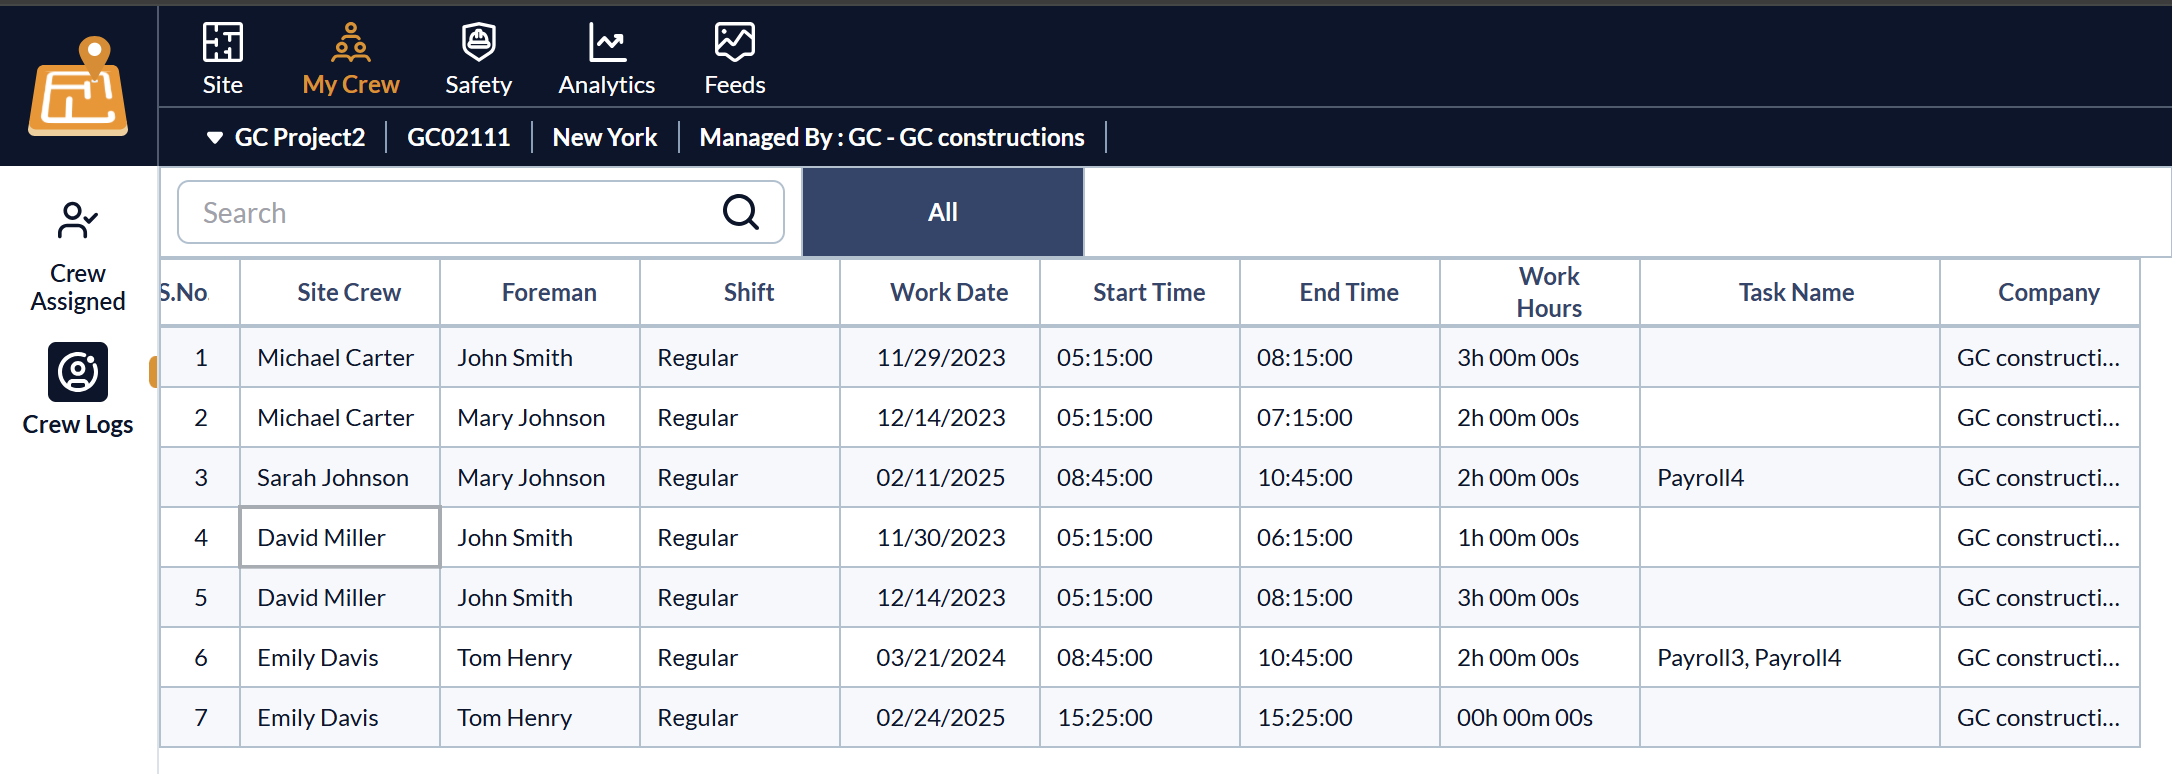
4. Crew‑Planned vs. Crew‑Actual Spread
Why it matters
If your schedule calls for six electricians and eight show up (or three), something is broken in communication. Repeated spreads wider than 20% torch labor budgets and float.
How to track
Compare forecasted crew counts from field data against actual timecard counts by trade.
Leadership move: Review spreads every Friday. Ask trade partners to explain variances greater than 10%. This conversation isn’t about placing blame, but rather about finding a collaborative solution.
5. Critical‑Path Health Index (CPHI)
Why it matters
Float on non‑critical tasks won’t save you if the critical path is already sick. Dodge Construction Network data shows that a CPHI below 0.7 predicts liquidated damages on 9 of 10 projects.
How to track
Count critical‑path activities on or ahead of baseline. Divide by total critical‑path activities.
Leadership move: Make “CPHI check‑up” a standing bullet in every OAC meeting. Owners will see that you confront risk before they raise it.
.png)
Pulling It All Together
- Start small. Track the idle‑time ratio and 48‑hour hit rate this month.
- Make metrics public. Print a one‑page “schedule health” scorecard.
- Tie to recognition. Reward crews who beat idle‑time goals, not just overall completion.
Within 30 days, you’ll shift conversations from firefighting to forecasting, turning data into proactive decisions that protect your margin.
Want more step‑by‑step guides on field‑ready construction analytics? Follow our newsletter or book a 15‑minute walkthrough of how mid‑size GCs embed these KPIs in their daily flow.

.webp)
.webp)